Making the right decisions is crucial for any individual or organization to succeed. However, it is equally important to ensure that those decisions are based on good data and analysis. With the abundance of information available today, it is easy to become overwhelmed and make decisions based on incomplete or inaccurate data. That's why it's critical to take the time to thoroughly analyze all available information, from various sources, before making any decisions. Good data analysis allows for a greater understanding of the situation and provides a clearer picture of the potential outcomes of a decision. By relying on sound analysis and data, individuals and organizations can make informed decisions that are more likely to lead to success. So, never underestimate the importance of good data and analysis in decision-making!

AC STEEL
Warsaw, poland
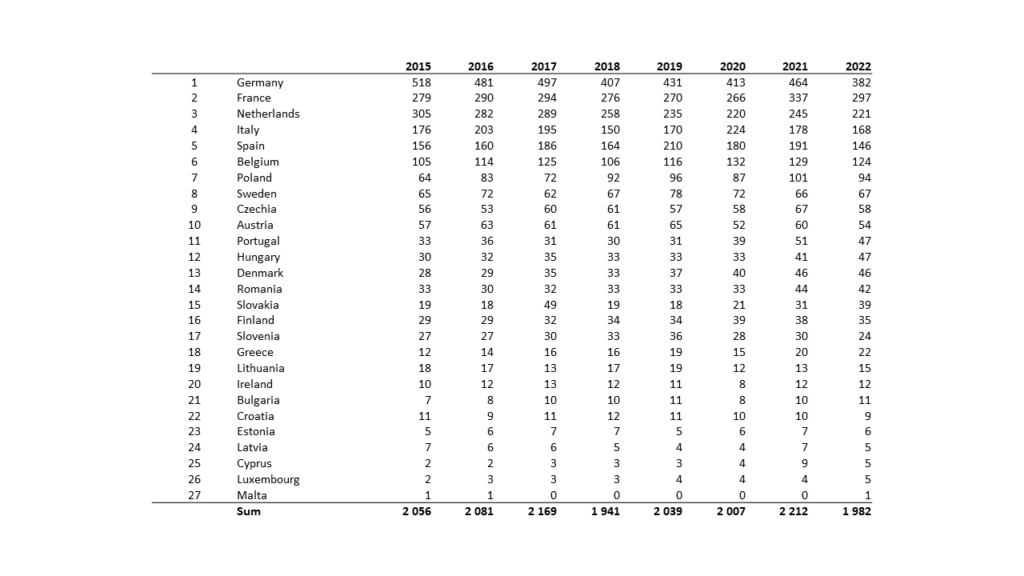
Import of aluminum scrap (2015 - 2022)
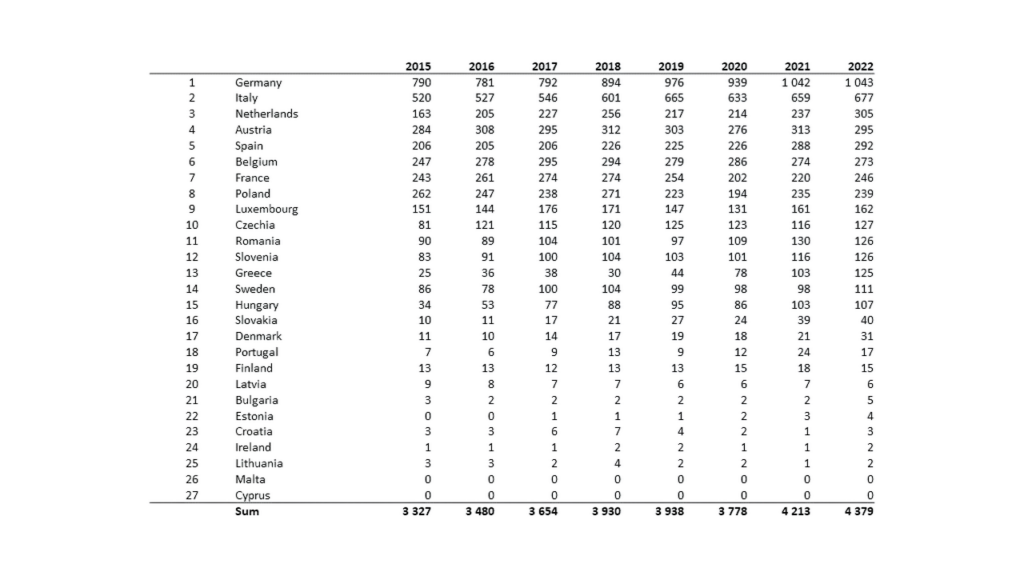
Export of aluminum scrap (2015 - 2022)
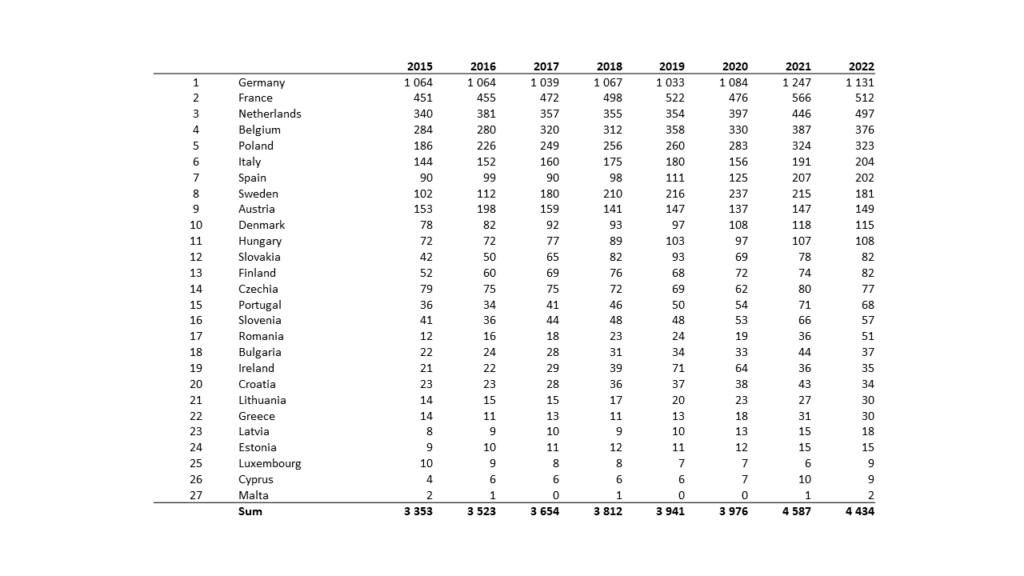
Import of copper scrap (2015 - 2022)
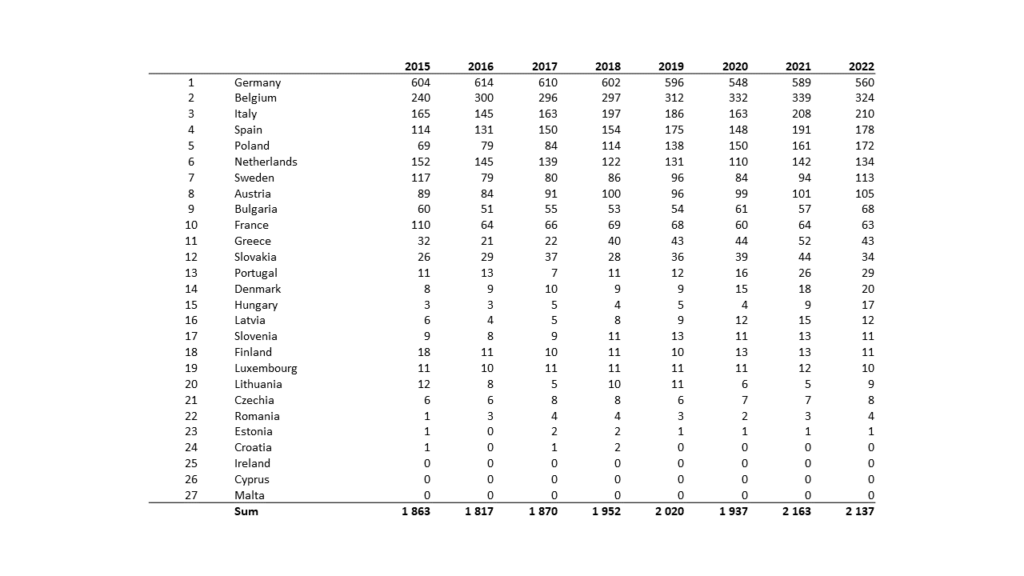
Export of copper scrap (2015 - 2022)